Analyze outliers in results file
Usage
anlzMWRoutlier(
  res = NULL,
  param,
  acc = NULL,
  fset = NULL,
  type = c("box", "jitterbox", "jitter"),
  group,
  dtrng = NULL,
  repel = TRUE,
  outliers = FALSE,
  labsize = 3,
  fill = "lightgrey",
  alpha = 0.8,
  width = 0.8,
  yscl = "auto",
  ttlsize = 1.2,
  bssize = 11,
  runchk = TRUE,
  warn = TRUE
)
Arguments
- res
character string of path to the results file or
data.framefor results returned byreadMWRresults- param
character string of the parameter to plot, must conform to entries in the
"Simple Parameter"column ofparamsMWR- acc
character string of path to the data quality objectives file for accuracy or
data.framereturned byreadMWRacc- fset
optional list of inputs with elements named
res,acc,frecom,sit, orwqxoverrides the other arguments- type
character indicating
"box","jitterbox", or"jitter", see details- group
character indicating whether the summaries are grouped by month, site, or week of year
- dtrng
character string of length two for the date ranges as YYYY-MM-DD, optional
- repel
logical indicating if overlapping outlier labels are offset
- outliers
logical indicating if outliers are returned to the console instead of plotting
- labsize
numeric indicating font size for the outlier labels
- fill
numeric indicating fill color for boxplots
- alpha
numeric from 0 to 1 indicating transparency of fill color
- width
numeric for width of boxplots
- yscl
character indicating one of
"auto"(default),"log", or"linear", see details- ttlsize
numeric value indicating font size of the title relative to other text in the plot
- bssize
numeric for overall plot text scaling, passed to
theme_minimal- runchk
logical to run data checks with
checkMWRresultsorcheckMWRacc, applies only ifresoraccare file paths- warn
logical to return warnings to the console (default)
Value
A ggplot object that can be further modified if outliers = FALSE, otherwise a data frame of outliers is returned.
Details
Outliers are defined following the standard ggplot definition as 1.5 times the inter-quartile range of each boxplot. The data frame returned if outliers = TRUE may vary based on the boxplot groupings defined by group.
Specifying type = "box" (default) will produce standard boxplots. Specifying type = "jitterbox" will produce boxplots with non-outlier observations jittered on top. Specifying type = "jitter" will suppress the boxplots and show only the jittered points and the outliers.
Specifying group = "week" will group the samples by week of year using an integer specifying the week. Note that there can be no common month/day indicating the start of the week between years and an integer is the only way to compare summaries if the results data span multiple years.
The y-axis scaling as arithmetic (linear) or logarithmic can be set with the yscl argument. If yscl = "auto" (default), the scaling is determined automatically from the data quality objective file for accuracy, i.e., parameters with "log" in any of the columns are plotted on log10-scale, otherwise arithmetic. Setting yscl = "linear" or yscl = "log" will set the axis as linear or log10-scale, respectively, regardless of the information in the data quality objective file for accuracy.
Any entries in resdat in the "Result Value" column as "BDL" or "AQL" are replaced with appropriate values in the "Quantitation Limit" column, if present, otherwise the "MDL" or "UQL" columns from the data quality objectives file for accuracy are used. Values as "BDL" use one half of the appropriate limit.
Examples
# results data path
respth <- system.file('extdata/ExampleResults.xlsx', package = 'MassWateR')
# results data
resdat <- readMWRresults(respth)
#> Running checks on results data...
#> Checking column names... OK
#> Checking all required columns are present... OK
#> Checking valid Activity Types... OK
#> Checking Activity Start Date formats... OK
#> Checking depth data present... OK
#> Checking for non-numeric values in Activity Depth/Height Measure... OK
#> Checking Activity Depth/Height Unit... OK
#> Checking Activity Relative Depth Name formats... OK
#> Checking values in Activity Depth/Height Measure > 1 m / 3.3 ft... OK
#> Checking Characteristic Name formats... OK
#> Checking Result Values... OK
#> Checking for non-numeric values in Quantitation Limit... OK
#> Checking QC Reference Values... OK
#> Checking for missing entries for Result Unit... OK
#> Checking if more than one unit per Characteristic Name... OK
#> Checking acceptable units for each entry in Characteristic Name... OK
#>
#> All checks passed!
# accuracy path
accpth <- system.file('extdata/ExampleDQOAccuracy.xlsx',
package = 'MassWateR')
# accuracy data
accdat <- readMWRacc(accpth)
#> Running checks on data quality objectives for accuracy...
#> Checking column names... OK
#> Checking all required columns are present... OK
#> Checking column types... OK
#> Checking no "na" in Value Range... OK
#> Checking for text other than <=, ≤, <, >=, ≥, >, ±, %, AQL, BQL, log, or all... OK
#> Checking overlaps in Value Range... OK
#> Checking gaps in Value Range... OK
#> Checking Parameter formats... OK
#> Checking for missing entries for unit (uom)... OK
#> Checking if more than one unit (uom) per Parameter... OK
#> Checking acceptable units (uom) for each entry in Parameter... OK
#> Checking empty columns... OK
#>
#> All checks passed!
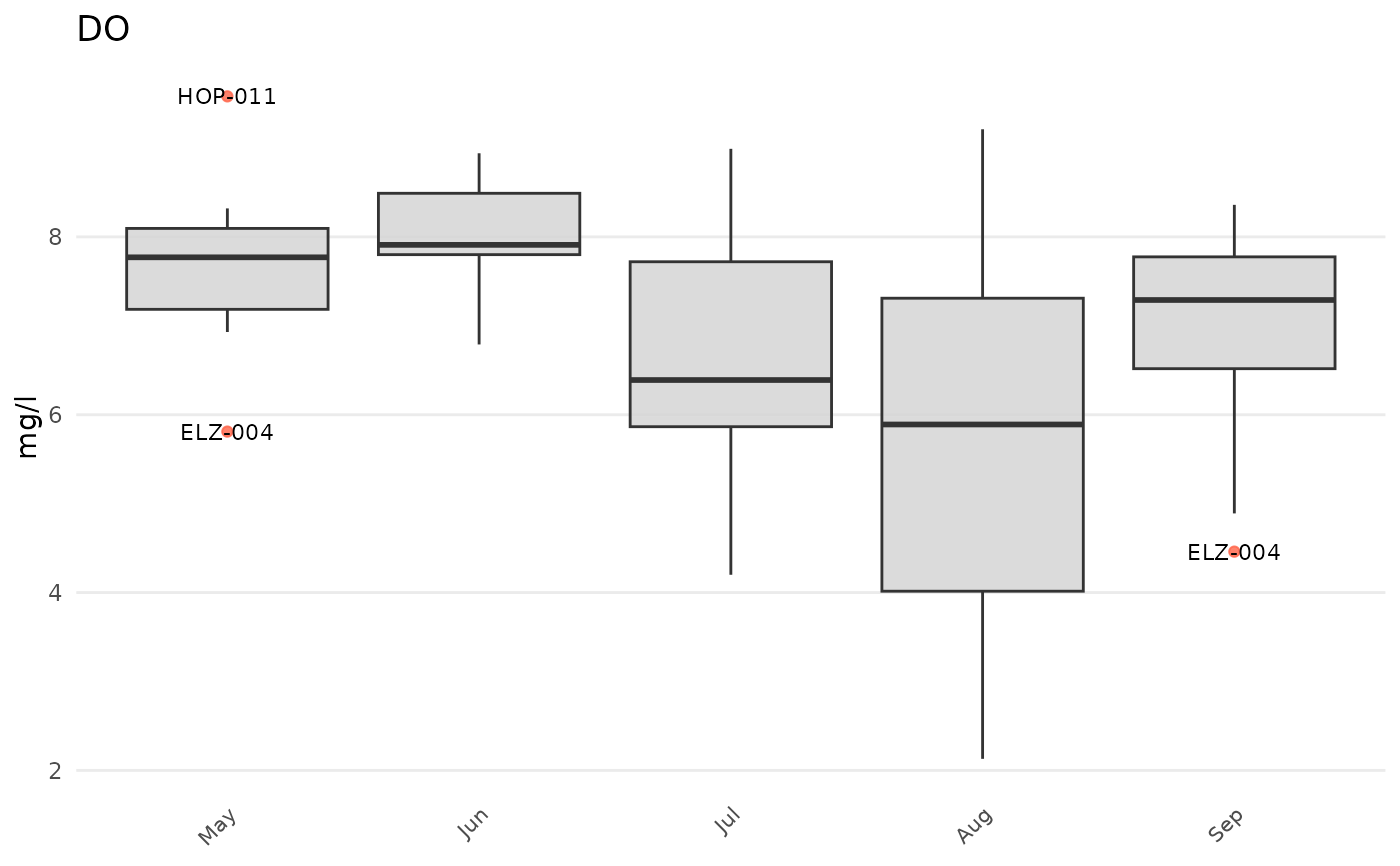
# outliers by month
anlzMWRoutlier(res = resdat, param = 'DO', acc = accdat, group = 'month')
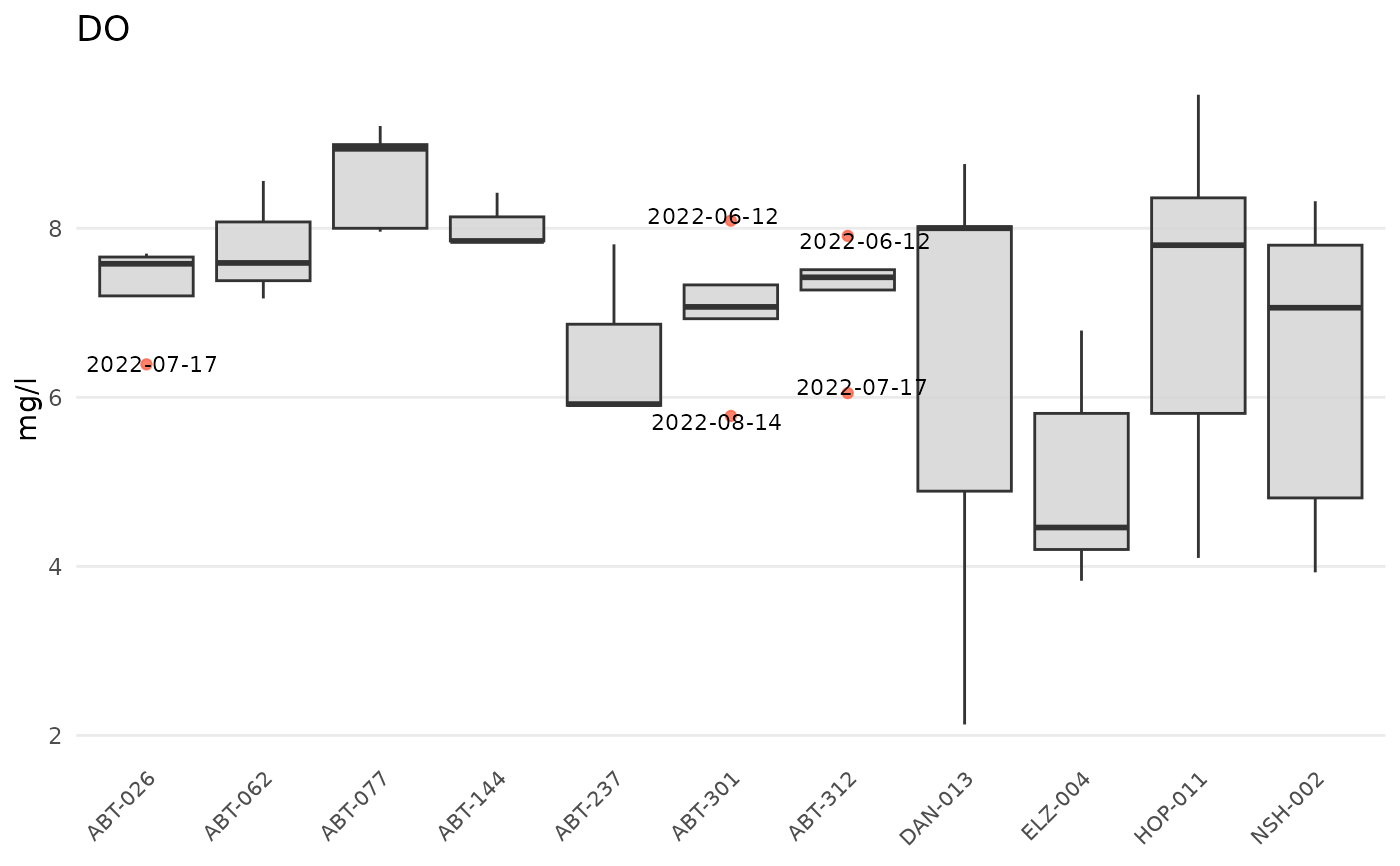
 # outliers by site
anlzMWRoutlier(res = resdat, param = 'DO', acc = accdat, group = 'site')
# outliers by site
anlzMWRoutlier(res = resdat, param = 'DO', acc = accdat, group = 'site')
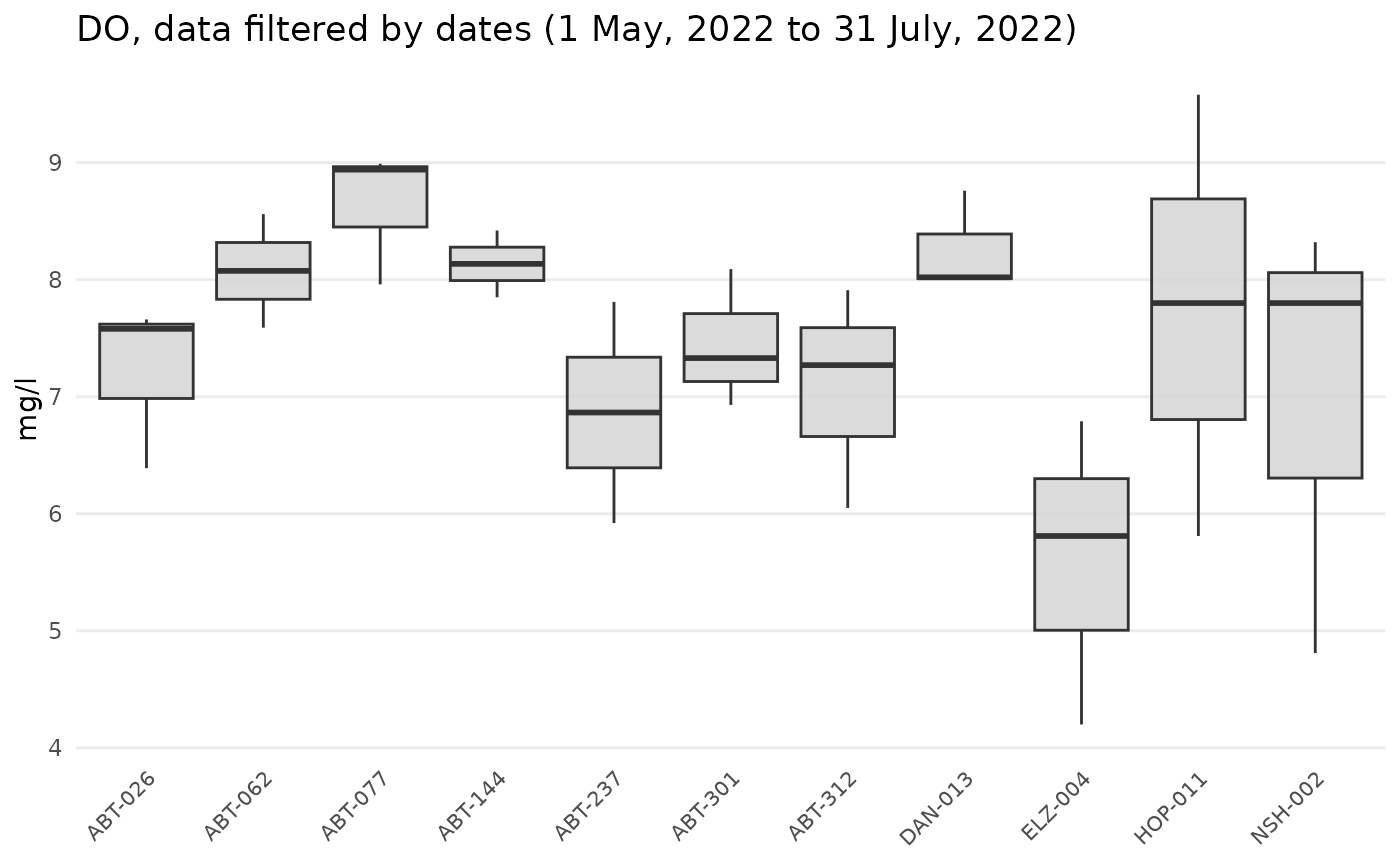
 # outliers by site, May through July 2021 only
anlzMWRoutlier(res = resdat, param = 'DO', acc = accdat, group = 'site',
dtrng = c('2022-05-01', '2022-07-31'))
# outliers by site, May through July 2021 only
anlzMWRoutlier(res = resdat, param = 'DO', acc = accdat, group = 'site',
dtrng = c('2022-05-01', '2022-07-31'))
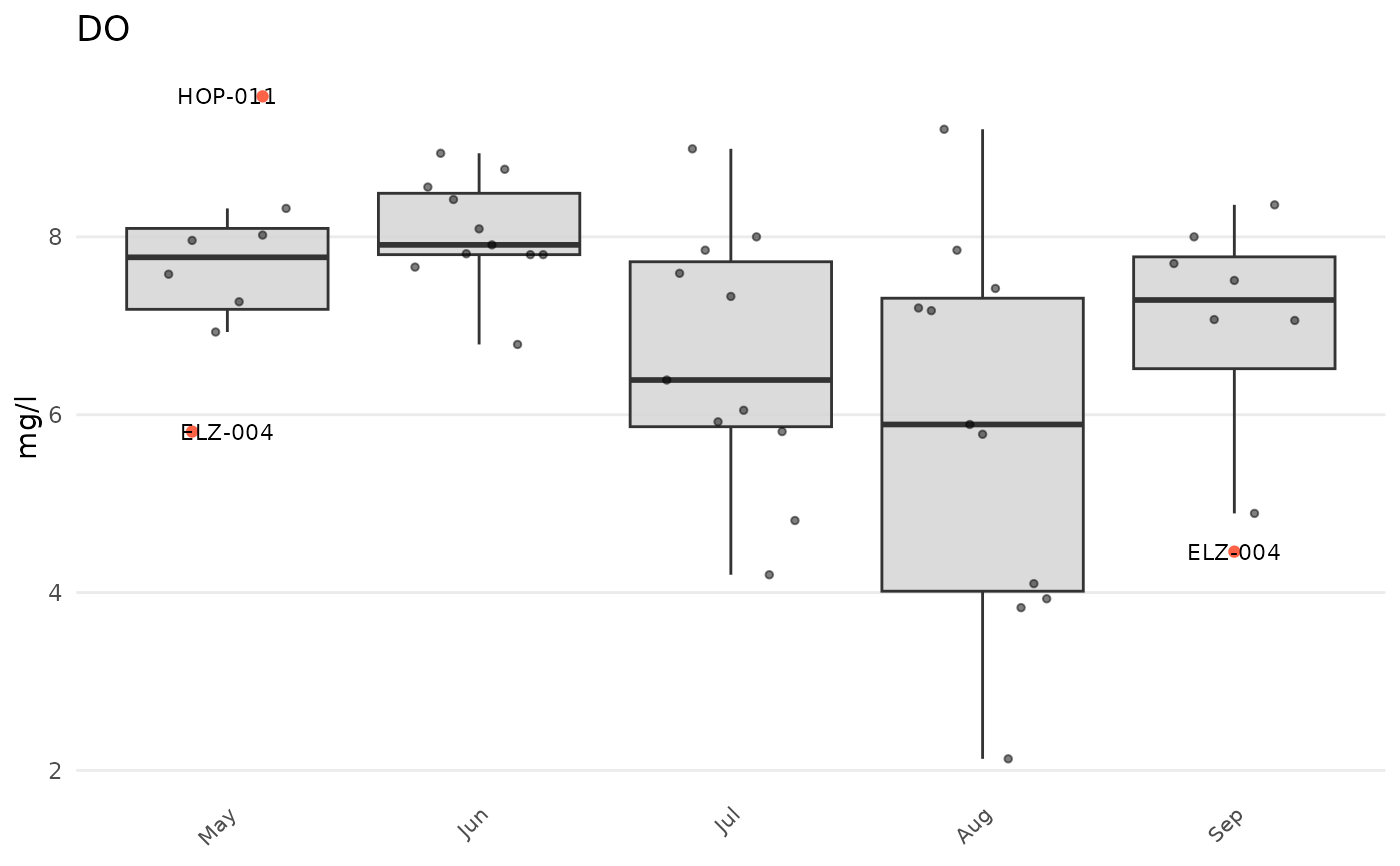
 # outliers by month, type as jitterbox
anlzMWRoutlier(res = resdat, param = 'DO', acc = accdat, group = 'month', type = 'jitterbox')
# outliers by month, type as jitterbox
anlzMWRoutlier(res = resdat, param = 'DO', acc = accdat, group = 'month', type = 'jitterbox')
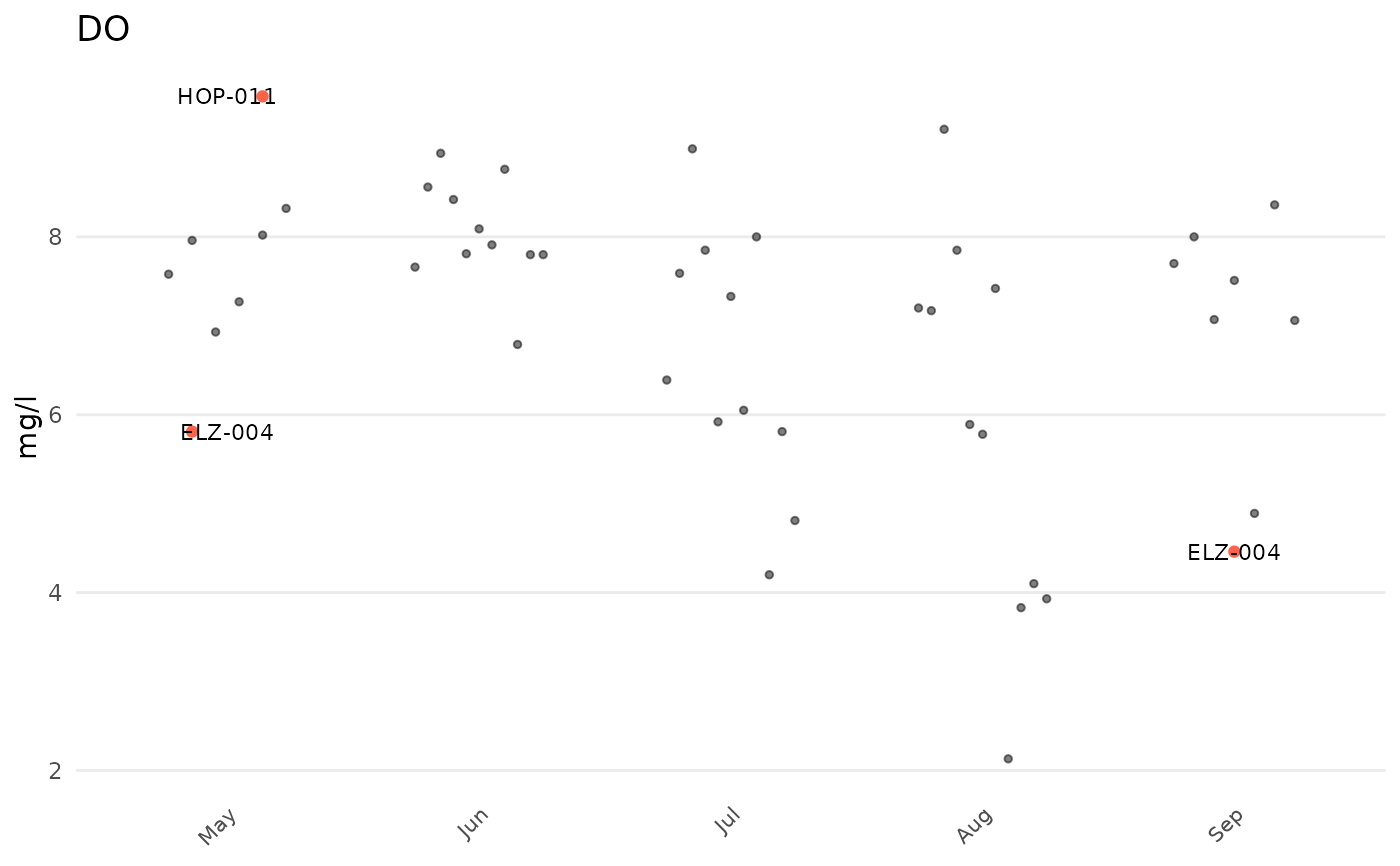
 # outliers by month, type as jitter
anlzMWRoutlier(res = resdat, param = 'DO', acc = accdat, group = 'month', type = 'jitter')
# outliers by month, type as jitter
anlzMWRoutlier(res = resdat, param = 'DO', acc = accdat, group = 'month', type = 'jitter')
 # data frame output
anlzMWRoutlier(res = resdat, param = 'DO', acc = accdat, group = 'month', outliers = TRUE)
#> # A tibble: 3 × 6
#> `Monitoring Location ID` `Activity Start Date` `Activity Start Time`
#> <chr> <dttm> <chr>
#> 1 ELZ-004 2022-05-15 00:00:00 06:50
#> 2 HOP-011 2022-05-15 00:00:00 06:55
#> 3 ELZ-004 2022-09-11 00:00:00 07:20
#> # ℹ 3 more variables: `Characteristic Name` <chr>, `Result Value` <dbl>,
#> # `Result Unit` <chr>
# data frame output
anlzMWRoutlier(res = resdat, param = 'DO', acc = accdat, group = 'month', outliers = TRUE)
#> # A tibble: 3 × 6
#> `Monitoring Location ID` `Activity Start Date` `Activity Start Time`
#> <chr> <dttm> <chr>
#> 1 ELZ-004 2022-05-15 00:00:00 06:50
#> 2 HOP-011 2022-05-15 00:00:00 06:55
#> 3 ELZ-004 2022-09-11 00:00:00 07:20
#> # ℹ 3 more variables: `Characteristic Name` <chr>, `Result Value` <dbl>,
#> # `Result Unit` <chr>